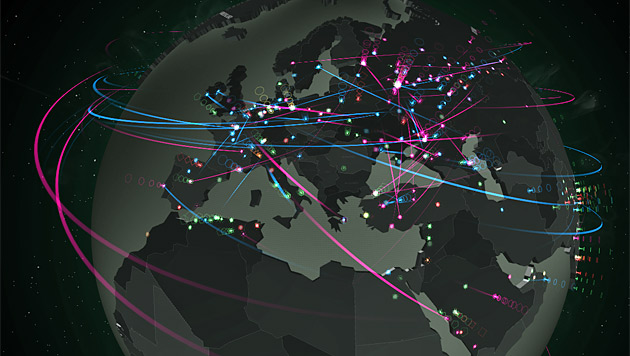
With access to a wealth of real time data, we created an interactive WebGL experience that dramatically brings to life every detection made by Kaspersky software, happening at that very moment, around the world.We denoted different threats with colours and geometric symbols. Some show the point of detection while others show the source of the threat as well, with bright, arcing trajectories linking source to destination. Users can zoom in and out of either a globe or flat map view to pinpoint the major threats and identify the most infected areas. A breakdown of each country’s level of infection can be triggered with a click, along with the ability to directly select your own country and share statistics through social. 
The visualization went on to feature on big screens at Kasperksy Lab events and trade shows around the world, using a specially designed demo mode which takes the audience on an autopilot fly-through that descends down to ground level and right into the heat of the action. The combination of true data and live statistics with an engaging user experience, tells a compelling story and hopefully provides Kaspersky with an eye-catching way to raise brand awareness, showcase their products and possibly remind a few people of their favorite childhood 80’s movies!
